HTTP-monitoring
Complete solution for prob monitoring HTTP services with several prob agents with a central reporting portal. The project includes realtime monitoring and SLA reporting with Kibana.
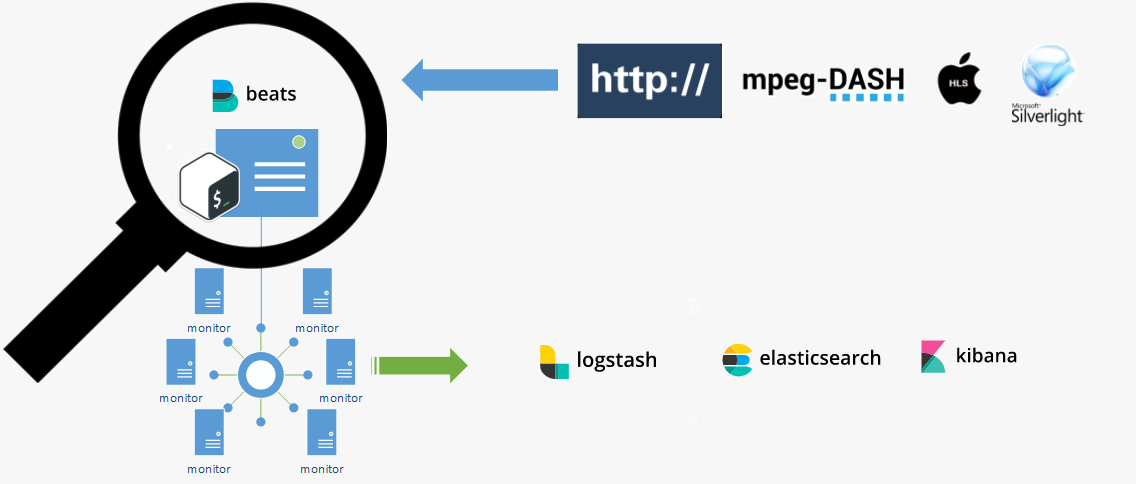
Monitor parameters
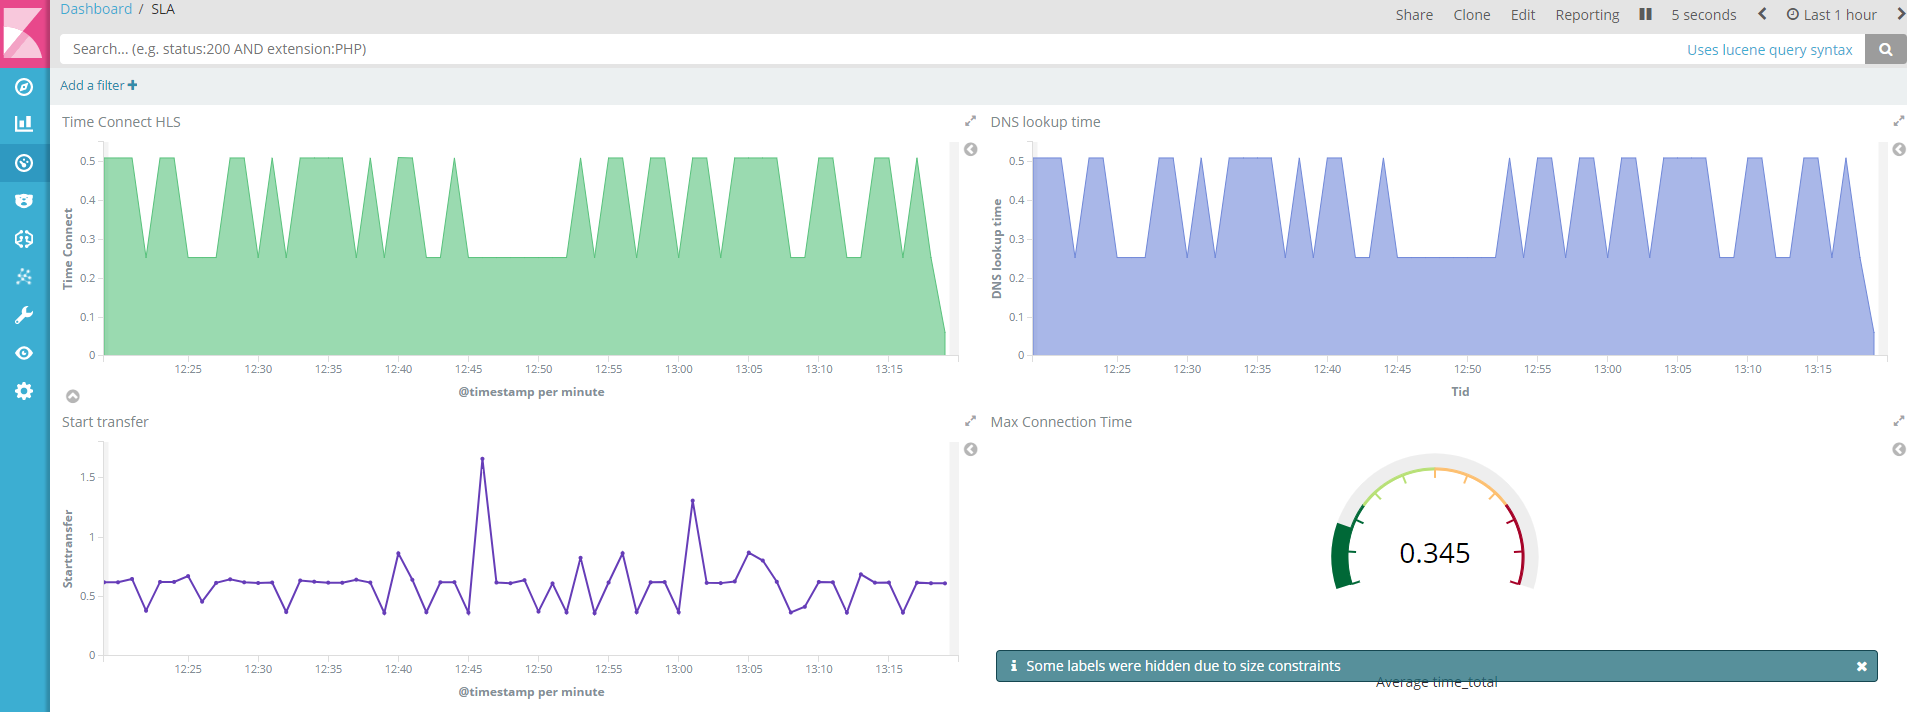
Time Connect The time, in seconds, it took from the start until the TCP connect to the remote host (or proxy) was completed.
Time Namelookup The time, in seconds, it took from the start until the name resolving was completed.
Time Pretransfer The time, in seconds, it took from the start until the file transfer was just about to begin. This includes all pre-transfer commands and negotiations that are specific to the particular protocol(s) involved.
Time starttransfer The time, in seconds, it took from the start until the first byte was just about to be transferred. This includes Time pretransfer and also the time the server needed to calculate the result.
Time redirect The time, in seconds, it took for all redirection steps including name lookup, connect, pretransfer and transfer before the final transaction was started. time_redirect shows the complete execution time for multiple redirections.
Time Total The total time, in seconds, that the full operation lasted.
Roadmap
- [x] v0.1 monitor HTTP
- [ ] v0.2 monitor HLS
- [ ] v0.3 monitor MSS
- [ ] v0.4 monitor DASH
- [ ] v.1 Raspberry pi prob
Requriments
Server
Ubuntu 16.04 x64 20 GB disk 6 GB ram
Prob
Ubuntu 16.04 x64 6 GB disk 384 MB ram
Setup servers
Preparations
Install git
sudo apt-get -y install git
Make tmp directory and clone HTTP-monitoring
cd /
sudo mkdir /tmp
cd /tmp
git clone https://github.com/Caripson/HTTP-monitoring.git
Install Java SDK
Download jdk-8u151-linux-x64.tar from http://www.oracle.com/technetwork/java/javase/downloads/jdk8-downloads-2133151.html to /tmp
Upload the file to http://transfer.sh so that you can easly install it later on monitor probes
cd /
cd /tmp
curl --upload-file ./jdk-8u151-linux-x64.tar  https://transfer.sh/jdk-8u151-linux-x64.tar
Start the installation
chmod +x /tmp/HTTP-monitoring/install-jdk8.sh
# Without downloading file
/tmp/HTTP-monitoring/install-jdk8.sh
Install Elasticsearch 6
# add the Elastic APT repo
echo "deb https://artifacts.elastic.co/packages/6.x/apt stable main" | sudo tee -a /etc/apt/sources.list.d/elastic-6.x.list


# trust the signing key
wget -qO - https://artifacts.elastic.co/GPG-KEY-elasticsearch | sudo apt-key add -


# update repo information
sudo apt-get -yq install apt-transport-https
sudo apt-get -yq update

# install
sudo apt-get -yq install elasticsearch
Install Logstash 6
Download and install the Public Signing Key:
wget -qO - https://artifacts.elastic.co/GPG-KEY-elasticsearch | sudo apt-key add -
You may need to install the apt-transport-https package on Debian before proceeding:
sudo apt-get install apt-transport-https
sudo apt-get -yq update
Save the repository definition to /etc/apt/sources.list.d/elastic-6.x.list:
echo "deb https://artifacts.elastic.co/packages/6.x/apt stable main" | sudo tee -a /etc/apt/sources.list.d/elastic-6.x.list
Run sudo apt-get update and the repository is ready for use. You can install it with:
sudo apt-get update && sudo apt-get install logstash
Install Kibana
Start the install of Kibana 6
wget -qO - https://artifacts.elastic.co/GPG-KEY-elasticsearch | sudo apt-key add -
sudo apt-get install apt-transport-https
echo "deb https://artifacts.elastic.co/packages/6.x/apt stable main" | sudo tee -a /etc/apt/sources.list.d/elastic-6.x.list
sudo apt-get update && sudo apt-get install kibana
Install X-Pack
Start the install of X-Pack
# install x-pack for elasticsearch  (reply 'y' to permissions question)
cd /usr/share/elasticsearch
sudo bin/elasticsearch-plugin install x-pack

# install x-pack for kibana
cd /usr/share/kibana
sudo bin/kibana-plugin install x-pack

# install x-pack for logstash
cd /usr/share/logstash
sudo bin/logstash-plugin install x-pack
Configuration Logstash, Kibana, Elasticsearch
Start config of logstash
chmod +x /tmp/HTTP-monitoring/logstash.sh
/tmp/HTTP-monitoring/logstash.sh
Start config if kibana
chmod +x /tmp/HTTP-monitoring/kibana.sh
/tmp/HTTP-monitoring/kibana.sh
Start config elasticsearch
chmod +x /tmp/HTTP-monitoring/elasticsearch.sh
/tmp/HTTP-monitoring/elasticsearch.sh
Install Nginx
Use apt to install Nginx and Apache2-utils
sudo apt-get install nginx apache2-utils
Configuration Nginx
Use htpasswd to create an admin user, called “kibanaadmin” (you should use another name), that can access the Kibana web interface:
sudo htpasswd -c /etc/nginx/htpasswd.users kibanaadmin
Start the config of Nginx
chmod +x /tmp/HTTP-monitoring/nginx.sh
/tmp/HTTP-monitoring/nginx.sh
Start services
Start the service
sudo systemctl start elasticsearch
sudo systemctl start kibana
sudo systemctl start logstash
sudo systemctl start nginx
Load Kibana Dashboards
First, download the sample dashboards archive to your home directory:
cd ~
curl -L -O https://download.elastic.co/beats/dashboards/beats-dashboards-1.1.0.zip
Install the unzip package with this command:
sudo apt-get -y install unzip
Next, extract the contents of the archive:
unzip beats-dashboards-*.zip
And load the sample dashboards, visualizations and Beats index patterns into Elasticsearch with these commands:
cd beats-dashboards-*
./load.sh
Load Filebeat Index Template in Elasticsearch
First, download the Filebeat index template to your home directory:
cd ~
curl -O https://gist.githubusercontent.com/thisismitch/3429023e8438cc25b86c/raw/d8c479e2a1adcea8b1fe86570e42abab0f10f364/filebeat-index-template.json
Then load the template with this command:
curl -XPUT 'http://localhost:9200/_template/filebeat?pretty' -d@filebeat-index-template.json
If the template loaded properly, you should see a message like this:
Output:
{
  "acknowledged" : true
}
Troubleshooting
Setup monitor probe
Install git
sudo apt-get -y install git
Make tmp directory and clone HTTP-monitoring
sudo mkdir /tmp
cd /tmp
git clone https://github.com/Caripson/HTTP-monitoring.git
Install Java SDK
Download jdk-8u144-linux-x64.tar.gz from http://www.oracle.com/technetwork/java/javase/downloads/jdk8-downloads-2133151.html to /tmp
Upload the file to http://transfer.sh so that you can easly install it later on monitor probes
cd /tmp
curl --upload-file ./jdk-8u144-linux-x64.tar.gz  https://transfer.sh/jdk-8u144-linux-x64.tar.gz
Start the installation
chmod +x /tmp/HTTP-monitoring/install-jdk8.sh
# Without downloading file
/tmp/HTTP-monitoring/install-jdk8.sh
Install FileBeat
On monitor probe, create the Beats source list:
echo "deb https://packages.elastic.co/beats/apt stable main" | sudo tee -a /etc/apt/sources.list.d/beats.list
It also uses the same GPG key as Elasticsearch, which can be installed with this command:
wget -qO - https://packages.elastic.co/GPG-KEY-elasticsearch | sudo apt-key add -
Then install the Filebeat package:
sudo apt-get update
sudo apt-get -y install filebeat
Update filebeat, press N (fix 20170908)
curl -L -O https://artifacts.elastic.co/downloads/beats/filebeat/filebeat-5.5.2-amd64.deb
sudo dpkg -i filebeat-5.5.2-amd64.deb
Configuration FileBeat
chmod +x /tmp/HTTP-monitoring/filebeat.sh
/tmp/HTTP-monitoring/filebeat.sh
Edit filebeat.yml
sudo vi /etc/filebeat/filebeat.yml
Update ELK Server IP with your monitor server ip
 ### Logstash as output
  logstash:
    # The Logstash hosts
    hosts: ["monitor_server_ip:5044"]
Now restart Filebeat to put our changes into place:
sudo service filebeat restart
sudo update-rc.d filebeat defaults 95 10
Setup and Config bash script
chmod +x /tmp/HTTP-monitoring/watcher/runme.sh
Update URL
vi /tmp/HTTP-monitoring/watcher/runme.sh
edit sURL=http://www.google.com/
Start services
/tmp/HTTP-monitoring/watcher/runme.sh
Troubleshooting
Check if logs is created
cat /home/2017*.log
Kibana dasboard setup
License
Unless stated otherwise all works are licensed under: MIT License
Contributors
Become a contributor to this project!
Sponsors
No sponsors yet! Will you be the first?
Become a contributor to this project!
